Graphical Splits Displays
More sophisticated methods of analysing split times, using WinSplits and SplitsBrowser:
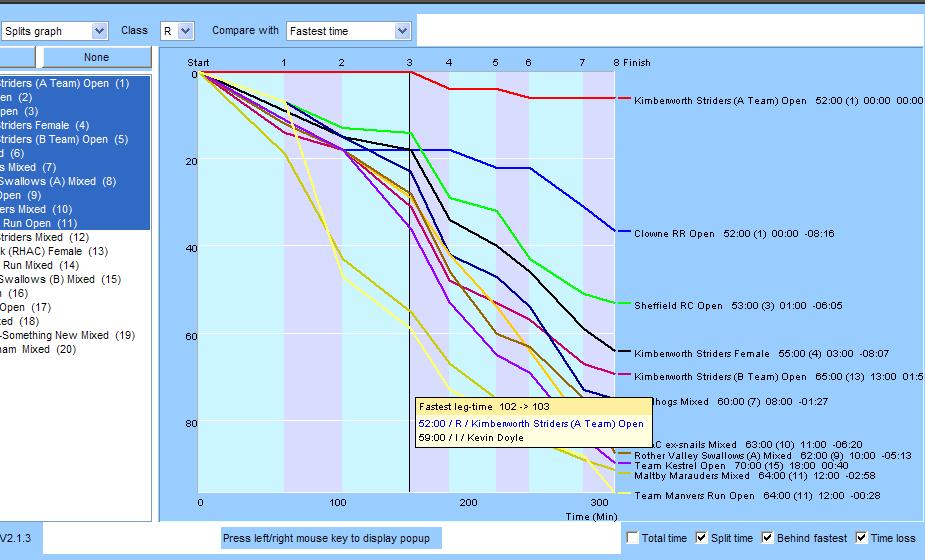
SplitsBrowser sample from Relay:

Interactive graphical presentation of individual and relay split times in Splits Browser. The earlier problem with loading files to SplitsBrowser has been resolved.
Splitsbrowser uses Java; as it loads, you may get a message asking if you
want to block the potentially unsafe application; click No
Select class I for Individual or R for Relay
Select who you want to check (All or specific individuals/teams, by clicking on them).
The
graph shows how each competitor has lost time, compared to the fastest time for
each stage, which corresponds to a horizontal straight line. Column widths
are proportional to the fastest time for the stage.
Various alternative analysis formats are available.
The graphs for the first 11 relay teams (class R) were selected. The horizontal red line from Start to 3 shows that the Kimberworth A team recorded the fastest (or equal fastest) time for these 3 stages. The line then drops from 3 to 4; it is the blue line for Clown RR that is horizontal, they producing the fastest time. Kimmy were fastest again for 4 to 5, Clown 5 to 6 and Kimmy again from 6 to the finish. The Clown line is also horizontal from 2 to 3, i.e. equal fastest to Kimmy.
The mouse pointer was on the 3 line; pressing the right button shows the fastest time recorded for this stage in the relay was 52 min, 59 min for the individual.
The numbers to the right of the team name show that, for stage 3, Kimberworth A team took 52 min, ranked 1st for stage, 0 min behind fastest and lost zero time relative to expectation, based on the overall time (to the finish). Clown clawed back 8:16. The Kimberworth Ladies (black line) took 55 min, 4th fastest for stage, 3 min behind fastest but still clawed back 8:07. Selection of times displayed is based on tick boxes to the bottom right.
You can select alternative formats, e.g. compare with a specific runner, your own team or (individual) yourself.
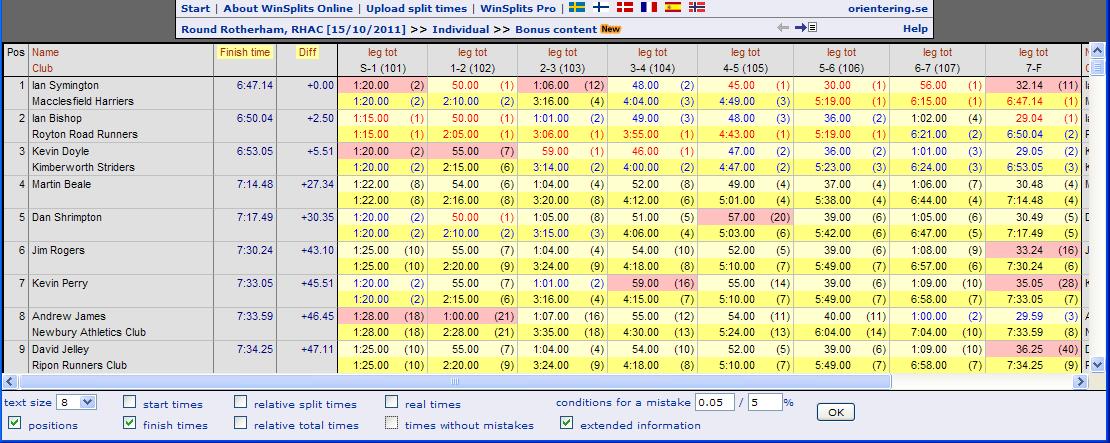
Split times in WinSplits Online (Table)
Click link for Split times in WinSplits Online
WinSplits is commercial software that helps analysis of split times from events
For each runner, position, name, club, finish time, time behind the winner and times and positions at each checkpoint are shown. There are two time rows. The upper row contains the split times, i.e. times between two subsequent checkpoints, and the lower row contains the total times, i e accumulated times from the start to a certain checkpoint. The positions are displayed within parentheses, on the upper row the ranking for the stage and on the second row the current race position. The appearance of the split time list can be altered by changing the settings at the bottom of the page. Read more about this (and other) topics in the WinSplits Help pages.

In this example, runners are listed in finish order. For each stage, the fastest time is shown as red type on a light background. The error criterion is set to 5%, which is relative to overall time adjusted for the stage. Times in black with a rose background reflect an error, i.e. the winner was (according to recorded times) slow on stages 1, 3 and 8. Slower times were recorded by others and not highlighted, e.g. David Jelley recorded 1:25 for stage 1, compared with the 1:20 by Ian Symington. For David, the difference is attributable to a slower running speed rather than an error, so is not highlighted.
 Colours
Colours are used to make certain information in the table appear more distinctly.
| red text colour | Red text colour indicates best split time and total time, respectively. |
| blue text colour | Blue text colour indicates that the split time or total time is among the three best. |
| grey, italic text colour | Interpolated times (times were interpolated before uploading, so this was not used) |
| pink background colour | Pink background colour means that time was lost on this stage, time taken was 25% longer than expected (taking overall time into account). See WinSplits Help for more information. |
| light yellow background colour | The light yellow hue of the background of the upper time row for each runner indicates that the times are split times. |
| darker yellow back colour | The somewhat darker yellow hue of the background of the lower of the time rows for each runner indicates that the times are total times (or real times if that setting is active). |
See Bonus Content which shows the head-to-head performance (win - draw - lose) between one runner and each other. The leg placement legend is half way down the page; position 1 (red), 2 or 3, 4-6, 7-10, 11-20, >20
Both utilities have split times for retirees up to the retirement point. In SplitsBrowser, the order of retirees has been randomly changed. The graphs are based on published results (but please let me know if you find any errors)